
https://hms.harvard.edu/news/most-important-question-about-long-covid
Image from Harvard News.

Posts related to the Covid-19 pandemic
It is not a single disease. We still don’t have a grasp of the underlying mechanism. We see several collections of symptoms: loss of smell and taste, severe fatigue, myocarditis (heart inflammation), lung disease / shortness of breath, mimicry of Chronic fatigue syndrome. I am glad there is significant work in this area, as it is possible that up to 1 million people are out of the workforce in America as a result of this illness.
This is a beautiful 3-D illustration of CT scan findings of COVID infection in the lungs, and the stories of the patients who survived, and now have changed lives as a result. Sobering, and illustrates, that even though our treatments and vaccines are excellent, we still have long term consequences for some with infection. Keep paying attention: Covid is not done with us.
Turns out, there are ways that science, with focused effort, can do good work, and quickly. Also, we should pay volunteer reviewers for medical journals!

https://www.wired.com/story/covid-19-open-science-public-health-data/
This is a nice quick (3 minute read) of the ways Science can be done quickly and effectively, and points out some of the common friction points that we can eliminate in our journey. Thanks to the NYTimes for giving us perspective on what we’ve just lived through.
https://www.wired.com/story/the-secrets-of-covid-brain-fog-are-starting-to-lift/
Image from Wired.com. Link to story above.
Instead of “Brain Fog” from Covid, we can now say “a loss of oligodendrocytes” and “microglial reactivity” are causes of decreased memory, cognitive sharpness and fatigue post Covid infection.
I love that our smart scientist colleagues are linking out to the chemotherapy and other viral research literature to find common threads and discover the basis for such puzzling syndromes.
I DON’T love the ongoing Covid infection numbers, the lack of masking, the decrease in vaccinations, as about 20 to 50% of all new Covid infections develop into forms of Long Covid, with Brain Fog being a long-term common symptom.
Even as the risk of hospitalizations fall with the latest Covid variant, the risk of Long Covid has not. We should all be concerned about this. Stay safe out there, colleagues. We need your brain power.
https://www.wired.com/story/what-is-paxlovid/
I found this to be timely and interesting.
As a physician, my advice (and what I continue to do now for myself, my patients, at this point in our Covid world):
At UCHealth, we still have test positivity rates in the 20% and 30%, which is a major underestimate of the illness, since there is widespread availability of home Covid testing, none of which is reported publicly. We are still seeing a substantial number of hospitalizations with Covid illness. The pandemic is changing, but this thing isn’t over y’all.
Stay well out there.
How do you fit a curve to your theories? Come along as CT tries to convince you that he’s right…
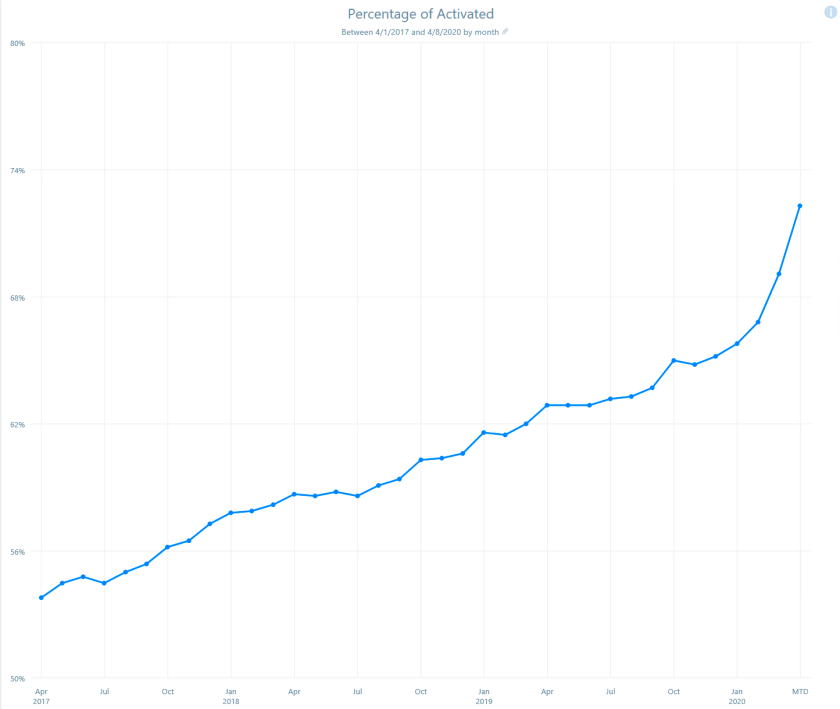
Over the past 2 years, our lives have been topsy-turvy. Here’s my previous post from April 2020 on the percent of patients using our My Health Connection portal at the beginning of the pandemic.
To be clear, the graphs I’ll be showing today indicates the percent of patients being seen each month at UCHealth, across all of our hospitals and clinics, who have an active My Health Connection (our brand of MyChart) patient portal account.
The tail end of the curve in March 2020 showed a dramatic uptick. So, what happened since then? In that 2020 post, I showed the March uptick in Patient Portal signups, anticipating an ongoing bump in patients. We believe this was mainly (back then) about connecting with the doctor, learning about and using Video (Virtual) Visits to see the doctor/provider since we were in the process of shutting down in-person clinics due to the pandemic.
Of course we know what happened next: an explosion of video visits (see previous post), then the availability of COVID testing, and later the availability of COVID vaccines, all of which were easier to request and obtain via the Portal.
In the graph below, we extend our original graph and add the months following March of 2020. I think we can agree that there was a steeper increase in patient portal signups below. Specifically the months between April 2020 to April to 2021, the curve looks different. And then, following April 2021, the curve appears to change again. How do we make sense of this?

One way to think about this to apply a logistic regression. I’m both too unskilled and also too lazy to attempt that. Here is my powerpoint-low-tech version, where I’ve simply pasted a line on top of the graph. Are you convinced? Do you agree that April 2020 to April 2021 shows a divergent signup rate, and that after April, the signup rate has returned to some sort of “inevitable baseline growth rate”?

As an aside, the curve above actually looks like that brilliant drawing by The Little Prince of an elephant swallowed by a boa constructor. Thus, the pachyderm.
Okay, back to our pseudo-analysis. Here is an alternate set of lines: maybe we just accelerated our patient portal signup for a year, and then hit our theoretical maximum at 86% of the population in our region being on the portal and there is no one else coming in, after April 2021?

Sure! That looks like a better fit, right?
OR, could it be that BOTH are the case, an immediate acceleration of patient portal signups in March/April 2020, sustained increase for the year that encompasses: video visits, COVID testing, COVID vaccines, THEN a leveling off of portal signups since then?

Another side observation: In the headlong rush for patients signing up for our online portal service, I’m personally finding more patients who “have an active portal account” who have not seen messages I’ve sent to them. I believe there is a growing fundamental problem here with several possible causes:
Three stories, three sets of arbitrarily drawn lines. I also know that our data scientists are skilled enough to be able to do the math to justify any of these power-point-line drawings.
CMIO’s take: Now that we are seeing a dramatic drop in cases from our Omicron surge, and our hospitals are down below 100% census for the first time in TWO YEARS, we can now sit back and do some armchair theorizing. And then plan for our next chapter. Which do YOU think it is? Let me know.
Here we are 19+ months into the pandemic. Time to look at our (unvalidated) trends within our 12 hospital, 1000 clinic health system in Colorado.
Top (blue) line indicates outpatient visit volume monthly from Sept 2019 through Sept 2021. Over 2 years, we saw that dramatic dip in volume in March. That was followed by a gradual recovery and a 10% sustained increase in volume since then. We have added some clinics to our system in the meantime.
Magenta line indicates online messages. We started at 58,000 monthly messages in September 2019, and have sustained 180,000 messages in the most recent 3 months of 2021, a 3 fold increase in patient messaging. OK to ignore that weird peak in Mar 2021, related to a one time system broadcast. This is a real concern for provider workload.
Orange: Surprisingly, we also see an increase in telephone messages (triage-type phone calls): from 23,000 to 35,000, a 1.5 x increase. This means that online messages have NOT replaced phone calls since the onset of the pandemic. This could be related to the growth in percentage of our patients who now have a portal account (growth from 70% to 85% of our patients enrolled in a portal account, over 1.6 million accounts), as well as existing portal-using patients sending more requests and messages, wanting to avoid in-person visits.
Red: Additionally, Scheduled Phone Calls (non-existent prior to pandemic) are now at 5000 monthly messages, and
Green: video (virtual) visits went from nearly zero, up to a peak of 70,000 a month, then stabilizing at 23,000 monthly.
It is an interesting, evolving picture. We have not formally changed staffing or workflow to accommodate this change in message and visit volume, and it has resulted in a massive increase in inbasket messages for providers and staff, with concerns of an unmanageable burden and real risks of burnout for providers and clinical staff.
We believe that, at its root, patients want care, are more anxious about their health during a pandemic, want to avoid in-person visits, have learned about our online tools, and are unclear as to the best way to interact with us.
We could: improve our “front door” experience “Here is how best to contact and work with us”. We could improve our triaging of incoming messages to find the right location/time/place (online message, eVisit by messaging, online chat, scheduled phone call, virtual visit, urgent care, emergency department, other innovative approach).
We could ensure our teams know the best practice for: handling patient questions, prescription renewals, referral requests, outreach programs, remote monitoring, when to suggest video or phone visits, huddling in-person to replace unending back-and-forth messaging.

As a result, we are kicking off a major Inbasket redesign initiative. Although our inbasket settings were carefully considered and modified over the years since 2011 (our original Epic go live) with careful feedback from our physicians and informaticists, we still have opportunities:
Just like with Physician Burnout and Wellness in general, there is plenty of work for everyone in Inbasket improvement: there are at least 8 arms to this octopus. Even if we can just “hack off” some of the arms (hmm, perhaps not the best metaphor for healthcare), we can certainly reshape the octopus into something more manageable (a starfish?).

CMIO’s take? Is your inbasket an octopus or starfish, or some other marine animal entirely? It is time for a wholesale re-imagining of our messaging and communications with patients and with each other. What are you and your teams doing in this area? Let me know.
Mass Vaccines, Epic, Apple, 5G, UCHealth. Sometimes it all comes together.
https://www.mmm-online.com/home/podcasts/the-mmm-podcast-6-24-21-zss-jacob-braude
This is a 28 minute podcast. The crucial moment (for me) is about 12:30.
Of the all the psychologies and tactics to address various subpopulations of the vaccine hesitate (for pediatrics, for adults, for COVID in particular), ONE tactic was most effective across all these subpopulations, use of “confirmation bias” as a tactic.
If you’re in a conversation about the vaccine, leave aside all the data and arguments.
Often we see people trying to persuade by saying ‘OK, here are the facts. Here’s why you should get vaccinated,’ ” Braude said. “But this research says actually what you should ask is ‘OK, why would someone want to get vaccinated?’ and have them go through the process in their own words. That works much better than the persuasion techniques we see people trying to use.
It turns out that 20-44% of people who answered this question, who were asked to TAKE THE EMPATHIC STEP of putting themselves in the shoes of someone wanting to be vaccinated, and then having to describe the reasons why, ended up changing their mind and agreeing to get vaccinated.
Huh. I think I have never done that. Time to learn and use something new.
CMIO’s take? There are so many interesting facets of the human mind. Even amongst physicians and healthcare workers, we have a lot to learn about how humans think, and how we make decisions. We need to harness this for the public good. Who is with me?
We have a monthly Epic Provider Newsletter where we share system updates, and I send CMIO Update paragraph to my colleagues. Here is my update for this month:
With our next Epic system upgrade this week, Covid Vaccine status is now in the patient Storyboard! This is HUGE. It is now instantly visible when opening the chart, if/when the patient was vaccinated. This should help with rapid patient assessments and counseling, since the Covid-19 Pandemic Crisis now morphs into Covid-19 Ongoing Management. Possible Vaccine Statuses include:
This is a nice improvement in our EHR.
IN PARALLEL, in discussions with colleagues this week, there is a sense that we are emerging from the pandemic. However, the prevalent emotion is not necessarily “relief”. Some say that they feel a sense of PTSD, or symptoms of exhaustion. In my mind, I feel like we have just finished running a sprint and are ready to stop and lie down.
BUT NO, there is no time take a break, it is time to resume the marathon of our regular healthcare jobs.
We spent the last 15 months putting aside our burnout, putting aside our lives, and putting EVERYTHING into fighting this crisis, hoping to extinguish it.
Now, we put down our crisis tools, and look up and see … no end in sight. There is no way we are all collectively taking a year-long vacation, and our psyche’s are just realizing, now it is back to our regular, difficult jobs.
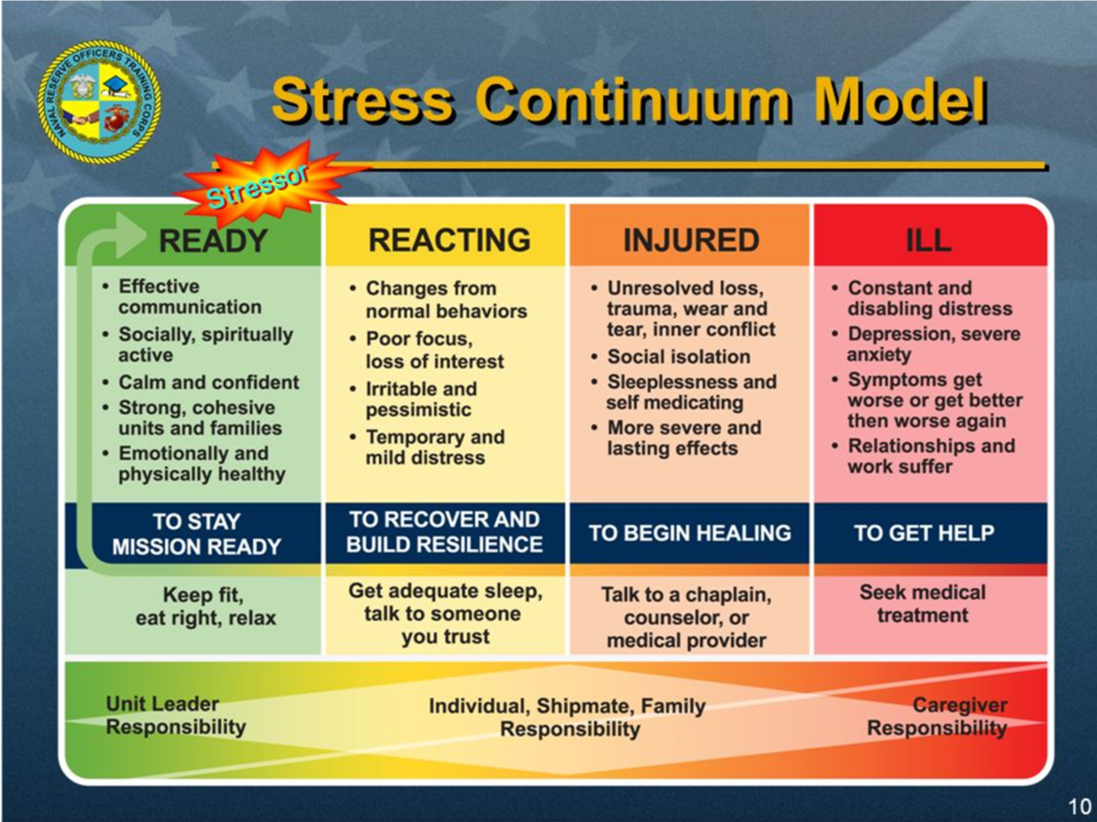
So, what is YOUR Covid Recovery Status on the grid below?
We are starting to use this Stress Continuum Model to assess ourselves, and each other. More than ever, we need to take care of ourselves, and each other.
CMIO’s take? I hope all of you DO find a way to ‘take a break’. Although it is not a celebration, we SHOULD recognize that we stood on the front lines of an astounding moment in history. I am proud to have stood with all of you.


