I had the pleasure of being interviewed by Mile Hi Magazine last week in regards to questions about how patients can cope with Covid-19 at home.
I responded to such questions as:
So many people contract but recover, is this what our body is designed to do?
Can people determine whether they have the virus without a test on symptoms alone?
When contracted, quarantine is the first step. What’s next in terms for two weeks – nutrition, special foods to eat to help the immune system fight?
Any special foods we should be eating now to be in top immune condition should we contract?
Any over-the-counter medicine to take for the fever or diarrhea?
Should people change out bed linen during the two-three weeks period?
Once fever breaks, is this a key sign that its over?
Should people exercise while body is fighting the infection?
Once over, should person we wait a couple days to ensure no symptoms return?
If Covid-19 is a flu strain, will it mutate into another strain as flu does each season for next winter?
Anything else you feel is pertinent to help people feel they can get over it if infected.
I made one particular point at the end of the interview. I shared our family’s strategy for coping with the anxiety and stress during this pandemic:
Exercise every day
Play or make music every day
Limit yourself to 30 minutes of news or social media daily
Three Good Things. At dinner each of us discusses THREE THINGS we are grateful for, today. INSTEAD of our natural tendency to focus on the negative, this exercise helps us reframe our day in a positive light.
CMIO’s take? I challenge all of us to do THREE GOOD THINGS with our loved ones at dinner every night.
This article “Misinformation Goes Viral” from the Medium is written by a PhD in Cellular and Molecular Medicine from Johns Hopkins School of Medicine, working now in Neurobiology at the University of Utah. Worth reading, and forwarding.
I agree with his well-written article and his sound reasoning, as a Professor of Medicine at the University of Colorado School of Medicine, the Chief Medical Information Officer at UCHealth, and a General Internal Medicine doctor seeing patients (now primarily via Telehealth!) in clinic.
His article has a number of main points with detailed explanations:
Americans did not have Covid 19 prior to Jan 2020
The virus is not man-made
Models are not deliberately misleading people
Covid is NOT the flu
Bill Gates is not a Bond villain
5G cell towers do not spread Covid
Healthcare workers are not paid off by big pharma
Herd immunity must be achieved through vaccination, not unchecked infection
CMIO’s take? Let science and rational thought triumph in these difficult times.
Guy Ristoff, his sister-in-law Mollie, and brother Bill
My name is Guy Ristoff. I work for the EPIC IT Team at UCHealth (Colorado) as an Analyst. I also have a 3D printer. A few weeks ago, I started seeing a bunch of people posting in 3D printer Facebook groups about ear guards to use with surgical masks. I thought it was a great idea for me to explore here at UCHealth.
I contacted a unit I have done some EPIC build for and asked if they would want some. I created my first 10, delivered them to the hospital, and hoped they liked them. I then contacted Gwen Martinez from the Clinical Informatics team and she sent an email blast to a group of people about the ear guards. Within 20 minutes, we started to get responses. It was amazing! The first few “orders” were coming from the Northern Region. My brother lives in Wellington and has 3D printer as well. I called and asked him if he would be interested in donating ear guards to the Poudre Valley and MCR. He was excited to help! His kiddos even got in on the fun by making thank you cards for the staff.
As for production, I can make 17 of them per batch, which takes about 4 hours. It is not a super-fast process, but it is a lot of fun making something that helps people be more comfortable. My brother has made and dropped off 80 of them. I have created 122 of them for the AMC and MHC campus so far. I am dropping those in the mail and at the hospital today! I will keep up production, so keep the orders coming. I am just happy to be able to help!
Here is my machine making a batch of themExample of a clinician wearing a mask protected by the ear guard
CMIO’s take? Thanks to all our creative Epic/IT team members like Guy, to step up and help in every way that they can. –CT Lin MD
The new normal? No white coat during Video Visits! (c) CT Lin
Executive Summary: We have a global pandemic, daily policy changes, we work from home, have new video tech, and we are learning to communicate and build relationships in new ways. It is easy to forget that there may be a scared patient on the other end, counting on us. How might we improve the patient experience? Some ideas:
IDEA DETAILS
Secure Chat with your MA
Scrub your schedule together, days ahead for patients more appropriate for telehealth vs in-person visits, med rec, troubleshooting, visit focus
Arrange your room, self
See tipsheet in Epic “Demonstrate Professionalism.“ How is: your room, your light, your clothing?
Eye Contactand, put a sticky note on PC cam to “LOOK HERE!”
Arrange the camera at eye level if possible. For some, looking down = frowning? Eye contact on video visits is EVEN MORE important. “If I look away it is because I’m looking at information in your chart”.
Avoid running late
If you DO, inform your MA by Epic secure chat & they can inform patient
Greet the patient
I like to raise my arms in surprise when we connect: every human connection now, is amazing. Maybe thank them for connecting with you. Ask if they’re in a safe private spot (eg: advise patient NOT to be driving!)
Talk, human to human
Ask: how are you coping (aside from medical concern)? Scared? Worried?
Reflective Listening
Even more important now in this time of anxiety. You can reflect or say back Data, Ideas, Feelings, Values. It strengthens connection: for example DATA: “It has been 5 days of worse symptoms?” IDEAS: “so you think it might be gout?” FEELINGS: “you’re worried about work? Hmm.” VALUES: “so, what’s important to you is your family.”
PEARLS
Some clinicians may have taken the Excellence in Communication course. The PEARLS acronym can also be helpful. Some examples: Partnership: “We’ll get through this together.” Empathy: (reflective listening, as above) Apology: “I’m really sorry that happened.” “I’m sorry for my part in it.” Respect: “You have worked really hard on this.” Legitimization: “Anyone in your situation would feel that way.” Support: “My team and I are here for you. We aren’t going anywhere.”
Physical Exam creativity
Teach them to take a pulse “say beep when you feel it” and YOU can count. Patients may have a BP cuff, Pulse ox, flashlight, thermometer.
Ask for help from family
Others may help add to history or exam findings
They may ask about YOU as a human
“How are YOU doctor? Are you staying safe?” So many surprising comments from patients worried about their doc. Thank them!
Brief LIFE advice
During pandemic, consider: A) Limit news/social media to 30 min/day. B) Exercise daily. C) THREE GOOD THINGS exercise: proven to reduce depression, anxiety if done consistently “What 3 things are you grateful for today?” Can become a great family habit at dinner.
AVS, Open Notes
From My Health Connection, they can see your AVS (after visit summary) and your Progress note (called Clinical Note) to remind them of details of your visit. Maybe at end of visit, ask: “Sometimes I don’t explain myself well. Can you tell me what you’ve heard, so we’re on the same page?”
Reassurance and Hope
“We’re going to get through this!” “Stay in touch with your loved ones.”
Ending the visit
Consider: a handwave OR palms together, nod OR thumbs up OR “You Got This!” Forecast next steps or if your MA will call them after.
Secure chat with your MA
Handoff any items after visit for continuity (referral, next visit, lab, etc)
And, here is how our Medical Office looks now, deconstructed. One part is in my basement …
The deconstructed doctor’s office (c) CT Lin
And here’s Medical Assistant Becky, hard at work keeping both the patient and the doctor on track at her home. That virus has got no chance against us.
CMIO’s take?Hang in there! You Got This!
Thanks to all my colleagues for letting me “borrow” their ideas for this post.
Okay, I acknowledge that I’m a data dilettante. Hmm. Interesting concept. I guess that is one step up from me being a data ignoramus. Having an anonymized population graphing tool in the EHR leads to amateur data exploration. Come along, won’t you?
DATA SET 1: 3 Years of CHIEF COMPLAINTS
The above graph shows 3 winters of data from our records, chief complaints of patients across our healthcare enterprise (4000+ doctors, several million patients) and number of patients each month with complaints of Cough (purple), Fever (blue), Shortness of Breath (yellow), and Diarrhea (red). Keep in mind: UCHealth grew in size over the past 3 years, with a growing number of hospitals and clinics, so the denominator number of patients is not the same from left to right. It also does not account for individual medical assistant or physician behavior who may or may not enter similar chief complaints across different patients, across different practices.
Nevertheless, I think you’d agree there is an interesting pattern here, including a higher peak of cough and fever this year! Wow: Covid19! But wait, that peak started in January. Unlikely the Covid-19 arrived IN SUCH VOLUME in January. But our old friends, other cold and flu viruses are plentiful. Hmm. So: Rhinovirus? RSV? Flu? See last post.
Look carefully, though, there is an interesting uptick in Shortness of breath in March 2020, out of proportion to the last 3 years … hmm. Interesting, but inconclusive.
And interestingly, diarrhea does not spike in winters, and doesn’t spike this winter either, despite (some) reports of Covid-related GI symptoms. Notably abdominal pain did not spike either (data not shown).
CONCLUSION 1: Fever, Cough, Shortness of breath are prevalent in our region BEFORE major Covid-19 activity, but some peaks seem higher.
DATA SET 2: REGIONAL CHIEF COMPLAINTS
Okay, lets take another step. What if we track SYMPTOMS (chief complaints), group them together and then see if we can find a Hot Spot where ONE region (UCHealth has 5-ish distinct geographic regions) has symptoms going up, disproportionate to other regions?
SURELY this means something!
See the yellow line shooting up at the beginning of March! This is the Denver region, compared to northern Colorado, southern Colorado, and a couple of other regions. These are percentages, not actual volume.
So, what does ACTUAL visit volume look like?
Slightly different view, by county and by actual volume of visits, and now you see a consistent plummeting of patients with “chief complaint” of fever, cough, shortness of breath. What is going on here?
The larger phenomenon is the Social Distancing order 3/21 and then the Stay at Home order on 3/26 by the governor of Colorado. So the sharp drop begins on the week of 3/21 and continues to plummet. At the same time UCHealth ramps up its Virtual Urgent Care and Primary Care service (allowing patients to see healthcare providers by video visits from home), which grows by hundreds and thousands of visits in late March. And who are likely the folks driving up Virtual visit volume at end of March? Yes, probably patients with Covid-19 symptoms.
Furthermore, Denver Metro is (I believe) more likely to have heard of UCHealth’s virtual urgent care and virtual visit service, more so than people in other Colorado communities.
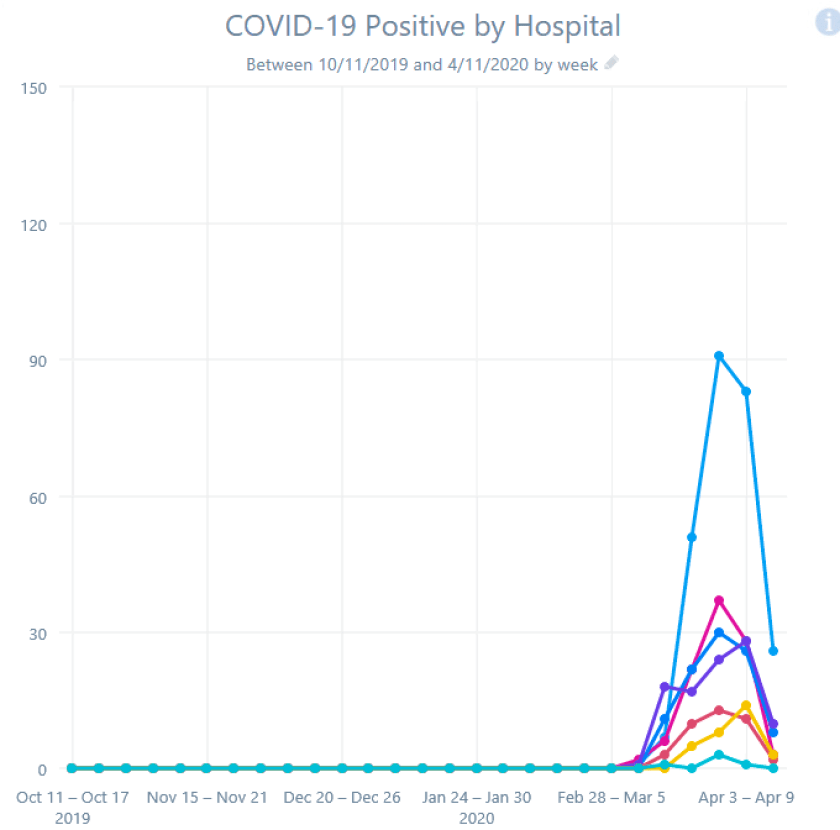
Finally, looking at the newly Covid+ patients in each of our hospitals during that same time frame (not a cumulative hospital census number), you DO see an increase in admissions the week of 3/20, and yes, more cases in the more densely populated metro Denver (blue line) but the peaks are synchronous and NOT trending differently from the other regions. If the divergent yellow Denver line (above) represented a real increase in spread, the below blue line should spike and continue to grow off the chart.
CONCLUSION 2: Be careful what you conclude! Knowing some of the underlying story, I conclude the divergent yellow line is NOT a disease spike, but a change in behavior and a new service starting AND some increased rate of spread in Denver.
DATA SET 3: COMPARE ONE REGION’S SYMPTOMS VS HOSPITALIZATIONS
One more exploration: could chief complaints (Cough, Fever, Shortness of Breath) of patients presenting to clinics BY REGION possibly explain an increase in Covid+ patients a few weeks later BY REGION? Perhaps use the data as an early-warning signal for hospitals that a Surge is coming, that the curve is about to go exponential? A leading indicator and not a trailing indicator?
Here’s Chief Complaint in Denver Metro (percent of visits):
Here’s Chief Complaint in Denver Metro (actual visits):
Here’s hospital admissions for Covid+, Denver Metro:
What is your analysis? Make up your mind … then scroll on.
CONCLUSION 3: I see the “percentage” of complaints start growing steeply on Feb 21. I see the hospitalizations start to rise Mar 13, about 4 weeks later. I see “actual count” of complaints peak and decline after Mar 13. I see hospitalizations peak and decline Mar 27, about 2 weeks later. We Found a Signal!
Danger, Will Robinson!
This is post-hoc data analysis at its best, looking back at the data in hindsight and saying “Of course I was right all along.” It fits a good story, infection rising in the community and the sickest showing up about 4 weeks later, infection falling in the community, and Covid-19 admission cases falling a couple weeks later. Maybe there is some truth here.
However, looking at data and graphs from another region, the Fever/Cough/Shortness of breath curve stays mostly flat, and yet the Covid-19 hospitalization bumps same time as Denver.
Go figure.
I hope this jaunt through the data gets you interested in thinking about data, in seeking patterns, in questioning your findings, in considering viral behavior, disease behavior, human behavior, health system behavior, government behavior.
And, we are thankful that our infection rate, our hospital capacity, our leaders in Colorado, our government/business/public health/health system/community leader relationships are strong and can work well together.
CMIO’s take? Data analysis is hard. Sometimes you find signal. Sometimes you find noise. Sometimes you mistake the one for the other. Armchair theorists and even amateur data dilettantes (including some enthusiastic CMIO’s) should be careful.
The Epic EHR has a tool called Slicer/Dicer that allows clinician-users to set up qualitative analyses of our populations in sophisticated ways. Of course this doesn’t replace the need for report-writers and more sophisticated analyses. But it is amazing what an informaticist can come up with, sitting in an Incident Command Center on an Easter Sunday with unusually few escalation phone calls to deal with.
For example, the curve above shows Influenza Positive test at UCHealth (12 hospitals, 600 clinics) over that past 3 winters: 2018-2020. Be cautious about interpreting the data: UCHealth has grown in number of clinicians and in patient volume, behavior of testing for “flu” may have changed. But it does look like the annual peak of flu positive patients is Jan or Feb each year.
Taking this further, our lab distinguishes Influenza A from B, and looks like “B” positive peaked in December vs “A” peaking in February.
Respiratory Syncitial Virus (RSV) peaked in February.
Rhinovirus peaked in September.
The “other” coronaviruses peaked between December and March.
Human Metapneumovirus peaked in March.
Finally, Our Coronavirus RNA test shows an ongoing increase (that last column showing Zero is an artifact of delayed reporting during my report run).
These are of course Lagging Indicators: trend lines that occur AFTER the fact: patients are in our hospitals, or are positive healthcare workers with symptoms. The constraint of insufficient testing kits to test everyone who has symptoms and indeed everyone who was exposed or has concern, gives us very little surveillance data to look forward for future outbreaks. More on surveillance ideas in an upcoming post.
It does occur to me, that in the coming months and years, that Medical Education could be turned on its head. In the past, I was clever enough to show our medical school leaders that this same Slicer tool could “make the textbook come alive.” For example, a student could create a graph, from existing UCHealth patient de-identified data, that the percent of patients with hypertension increased if you compared those with a BMI of up to 20, then 21-25, 26-30, 31-35, 35-40, and then greater than 40. You could see the that the percentage increased from 5% into the 32% range. Voila: possible relationship between Body Mass Index and prevalence of hypertension!
Repeat with diabetes, high cholesterol, asthma. See what blood pressures are typical for patients on a particular BP medication.
And for our current topic, have students figure out when respiratory viruses peak over the year, instead of reading a book chapter on ‘Pathophysiology of viruses.’ That would be a med school class I’d like to take. Maybe have students help with our CURRENT problem of trying to use our EHR to detect signal for patients about to deteriorate for Covid-19.
CMIO’s take? The EHR is becoming an integral part of how a modern doc takes the deluge of health data and uses that power for good.
Inpatient Guide for Outpatient Docs: Table of Contents
Covid-19 threatens to hospitalize an exponentially increasing number of patients in the coming weeks. In addition to building more physical space and finding more equipment, what happens when we run out of hospitalists to manage their care? What if, instead of our usual 10 teams of hospitalists, we need 20 teams? Thirty simultaneous teams?
Thanks to CT for the guest-blogging spot. I’m a physician / programmer working at the University of Colorado and UCHealth, helping our system prepare for the Covid-19 crisis.
Seeing the the massive surges in patient volume related to the Covid-19 pandemic that befell our colleagues in China, Europe and New York, we knew that we would have to find “surge capacity” among providers in our area.
We guessed that outpatient docs (like CT and me) would be needed to support the inpatient service, where neither of us have been for a long time.
I for one, was relatively panicked by the thought of serving on the inpatient service. Not only is it a different branch of medicine at this point, more than a decade from my training years, but from an informatics perspective, the workflow is completely different. I figured that if someone with my (relatively high-level) of comfort with the Epic EHR was feeling stress, others would be as well.
So roughly four weeks ago, I reached out to my informatics colleague on the inpatient service and suggested that we leverage our existing training videos to quickly produce a comprehensive written and video guide to the inpatient service, targeted at these likely recruits.
He and I, together with three other hospitalists, another outpatient internist and an informatics neurologist, quickly compiled a comprehensive document of workflow and tips.
We were gratified to find that a large number of internists practicing outpatient (clinic) medicine were willing to serve as part of the Surge teams and were interested in this just-in-time training.
There was so much interest in our training tools (document plus embedded videos) that the University of Colorado General Medicine division re-arranged the Grand Rounds schedule, and we presented this material to 150 interested outpatient internists at this week’s Grand Rounds, held by Zoom meeting.
We are so grateful that our cross-specialty relationships and shared technical expertise that are unique to informatics allowed us to create and present this material in a matter of days. Our wish:
That our surge of hospital patients is manageable
That our hospitalists stay safe and healthy
That any outpatient providers who are called to duty stay safe and healthy
We are grateful for the role we’ve played, and will continue to play
Rich Altman, MD, University of Colorado
I hope that you can benefit from these documents. However, the longer view and greater message is the value of a strong informatics team which is uniquely positioned to rapidly mobilize and meet unforeseen needs.
Amidst the furor of the health industry struggling to battle a microscopic foe, there are some interesting tidbits. And a data update, thanks to a question by @TheLizArmy on Twitter.
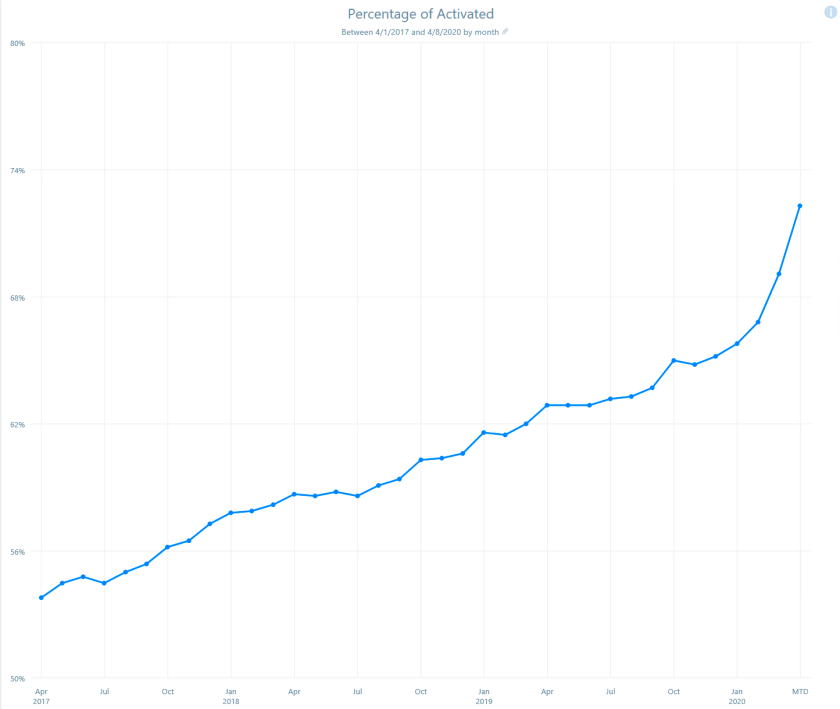
Here’s the TL;DR: Pandemic concerns, relaxation of Federal rules and Stay-at-home orders have resulted in explosive growth in our patient-portal sign ups at UCHealth. We went from 66% to 72% of patients seen between February and April 2020 with an active Patient Portal account. Look at the sharp up-tick. We are now at 700,000 online patients from 650,000 last month! AND, as of yesterday, our Video Visit count exceeded 4000 PER DAY.
All because of a tiny micro-capsid of proteins and a short strand of RNA.
Evil RNA-based life form? Can’t we just get along?
==INSERT SHORT AUTOBIOGRAPHIC ASIDE HERE==
In 1984, I spent a summer studying under Richard Goldstein PhD at the Harvard Medical School Genetics and Microbiology Department, and writing my thesis on the genetic makeup of the P4 bacteriophage, cutting and splicing DNA to figure out how the darn thing worked.
I stayed for the summer with a friend in an apartment on Massachusetts Avenue, and would ride my bike through Cambridge, over the Charles River and into Boston and the Lab. It was a good summer; I even decorated my bike helmet and called it my Bike Capsid:
Actual photo I printed and glued on my bike helmet in 1984
I celebrate my nerdiness.
A capsid is what the virus packages it’s DNA into to travel between bacteria. The tiny feet are what stick-it to a bacterial cell wall, and the tube is what the DNA is injected through, into the innards of the cell, like pirates commandeering a hapless merchant ship.
It so happened, that one late morning, the traffic was backed up for a half mile at the bridge over the Charles; a traffic cop guarded the crossing. I rode up on my commuter bike: “Hey Officer, what’s going on? Why is the bridge closed?”
He looked at me with disgust? boredom? and replied: “Dinah-soah comin’ up the ri-vah” and walked away.
Dinah … WHAT?!
I turned to a nearby passenger on a public transit bus with an open window: “Did he just say: “Dinosaur coming up the river?” The guy just shrugged.
Which is all to say: me and viruses, we go way back. And Dino’s are sometimes the hero of the story.
And while I’m meandering, it is fascinating that humans, in their slow, inevitable, dino-like lurch toward progress, sometimes put up such barriers (Federal Medicare prohibition of paying for telehealth, HIPAA Privacy concerns stopping the use of commercial 2-way video, cross-state prohibition on the practice of medicine) that we get in our own way. And then it takes a tiny little single RNA strand and a couple of proteins, to change the globe, and our lives.
The uptick on the curve above proves that humans crave connection. The uptick looks kinda like … the neck of a dinosaur? Anyway, here’s proof that dinosaurs are still ready to battle viruses on behalf of humans, growling in the Command Center at UCHealth.
CMIO’s take? What is your interesting back-story? Lately, we only have one channel in our brains: survive and defeat Covid-19. But we are so much more interesting to each other than that.
In-person clinic visits by week (red) and virtual visits (blue) at UCHealth, part of 2019-2020: UNVALIDATED DATA (red blips are likely Thanksgiving and December Holidays)
As recently as 2 months ago, we, the virtual visit leadership team, sat in a conference room bemoaning our fates: HOW will we get our 4000 providers (doctors and advanced practice providers) to start conducting Telehealth or Virtual Visits with patients? In all of 2019, our organization conducted about 2700 visits between providers and patients. This was a disappointing number, having spent a year integrating a 2-way video system (Vidyo) inside our Electronic Health Record (Epic). This was also disappointing because the state of Colorado passed the Parity law requiring insurers to reimburse healthcare providers the same rate for video visits as with in-person visits. What else could one want? Video visits for everybody!
Not so fast.
Turns out, doctors are humans too: you figure out a way to do something well (in-person visits with all your equipment for vital signs, sensors, gee-gaws, tests, fine-tuned teamwork honed over decades of practice), you don’t wanna change.
“If it ain’t broke, don’t fix it.”
CT’s inscrutable high school coach, to an uncomprehending student
We came up with all sorts of leadership plans to increase video visits: more education to front-line physicians (not helpful); sending experts to clinic to tout the benefits (nope); introducing video visits to clinicians already on bundled payments, such as surgeons whose post-op visits were no-fee (slight adoption). Video visit adoption was a local phenomenon: a few docs found it useful and did several hundred visits that way over the course of a year, and most others did not try it. Finally, we did get some traction by dedicating some urgent care docs to Virtual Urgent Care, for either a flat $49 fee or co-pay with participating insurers. For the most part though, bupkis.
In the graph above, the blue line indicates fewer than 100 video visits a week leading up to … March 2020.
And then, we know what happens next: PANDEMIC. Social Distancing. Stay-at-Home order from the governor. Suddenly clinic in-person visits plummet. And all across our 600 clinics: “Hey, wasn’t there someone here last year talking about some kind of video-thingy that we could use to see patients? Anybody have their phone number?”
We are luckier (or perhaps more prepared) than most other healthcare organizations:
We already integrated video into our EHR
We have a high-functioning IT infrastructure on a single EHR
We have a strong informatics group (physicians, APP’s, nurses)
Our clinical and administrative leaders collaborate well, and nimbly
HHS relaxed the rule for HIPAA-regulation on providers of video (allowing for Skype, Zoom, even FaceTime), not that our organization needed this.
As a result, within a week of that first pandemic-related request from our providers, we scaled from 2700 visits in ALL of 2019, about a dozen per day, to 3000+ visits PER DAY. Lets say that again:
Video visits went from a dozen per day to 3000+ per day within a week
That’s just crazy talk. And also proof that John Kotter is STILL right, from his book Leading Change: Your first step is a creating a sense of urgency: a Burning Platform. And boy do we have one now, thanks to a microscopic life form .
And now? Now, I sit here in my home office, with my laptop and my smartphone connected, waiting for my next patient, who is visiting me from their home, arranged by my medical assistant, sitting at her home. Our bricks-and-mortar medical office is 2/3 empty, with a reduced crew seeing in-person visits for those without video visit tools, or needing physical exam or other services.
When we connect, every interaction feels like a victory. Every “return visit” feels like re-connecting with an old friend. In fact, I reflexively raise both arms like our team scored a goal:
“You made it!”
“Yes, I did!”
“It is GREAT to see you!”
“Yes! And how are YOU, doctor? Are you doing okay?”
The empathy of patients toward ME and my colleagues, is touching, and genuine, and so much appreciated. Unbiased opinion: longitudinal primary care internal medicine has the BEST patients in the world. Truth.
CMIO’s take? We are creating a new healthcare world, by necessity. Will we ever go back?
A recapitulation of a series of tweets about my recent experience at the UCHealth’s command center. I rotate the responsibility for the physician support position with about a half-dozen other docs. The command center has been up for almost 3 weeks now.
1/ A day @uchealth Incident Command Center. Constant stream of calls. Room is full of experts (infectious diseases, pulmonary, disaster) with a dozen other directors. Like being the frontal cortex of a massive organism…
2/ If you’ve never served in a Command Center, it is scary as heck, and also exhilarating. Things happen and decisions are made in minutes and hours, not weeks and months, as is more usual in a large organization… is that
3/ Sample incoming call: ‘ICU wants to know whether to send a second COVID test nasal swab on a patient whose test was negative yesterday but the team has high suspicion they have COVID.’ (Yes, not via nasal swab, but by tracheal aspirate for better sampling)
4/ Sample call: ‘Community organization purchased 10 COVID tests somewhere; would we send a medical assistant to perform swabs on their employees.’ (No, test performs poorly for patients with no symptoms.’ and, how do you choose who to swab? And, what would you do differently if you have a result? negative: stay home. Positive: stay home(!)
5/ Sample call: ‘Hey, if ventilators are scarce, we could build Iron Lungs faster: want some?’ (After internal discussion, no: COVID is associated with ARDS (adult respiratory distress syndrome). ARDS causes stiff lungs, unlike polio, and even then they didn’t work well), AND, how to manage IVs and catheters?
6/ Our converted conference room now is 24/7 staffed with executives, directors, nurses, doctors, staff who connect to every part of our 12-hospital, 600 clinic, 4000 provider system. Kinda like a neocortex…
7/ We sit and take calls from all over the system, clarifying the daily-changing policy, delivering nimble responses to moment-to-moment events in our EDs, our clinics, our hospital wards …
8/ We huddle in purposeful groups through the day: medical officers, informaticists, nurse leadership, respiratory therapists, ICU teams, hospitalists, data analysts, facility managers, tent-building teams(!) …
9/ We ‘run the board’ twice a day to ensure our top issues are addressed, re-prioritized, to keep our eye on the ball: racing ahead of the coming tsunami of COVID-infected patients collapsing on our doorstep…
10/ We marshal our supplies, build negative pressure rooms, re-allocate staff, negotiate new partnerships, create and dissolve projects to solve immediate problems…
11/ Dramatically expand our Virtual Health Center for Virtual Urgent Care, expand our nurse call line to handle COVID concern calls, go from 2700 virtual visits last year to 3000 virtual visits per DAY this week…
12/ Discover new trends: hypoxic COVID patients who are surprisingly not short of breath, patients who oxygenate better laying on their stomachs, how poorly bleach wipes interact with electronics(!) …
13/ We tearfully celebrate improvement: today a cluster of patients successfully extubated from the vent, a few patients de-cannulated from ECMO, a hallway of nurses applauding an ECMO survivor…
14/ And yet we have fun… Jurassic organisms battle for supremacy while modern organisms do the same.
15/ Our loyal administrative intern asked our Incident Commander at the end of her day shift: ‘How do you feel? How do you think we’re doing?’ …
16/ Her reply: ‘For the world, terrible. For our country, very worried. Here, we have prepped well, we have a great team, we forecast constantly, and we are going to meet this challenge.’ So proud of her, and us.


